Blog
Some thoughts about supply management, trade negotiations, and the number of farms
Sebastien Pouliot, Ph.D.Series: Agriculture
Federal political parties pledged to protect supply management during the latest elections but have not committed to keeping it untouched. We can expect the United States will ask concessions from Canada in sectors under supply management (i.e., dairy, poultry and eggs) in upcoming trade negotiations. The concessions could take various forms, including increased market access and modifications to rules for the allocation of import licences. This blog post is about increased market access and the competitiveness of Canadian farms.
I employ a simple model where farms differ in their production costs to show how increased market access affects supply managed sectors in Canada. Of course, the model simplifies certain realities but it does well in showing the impacts of market expansion on Canadian farms and what can be done to mitigate them. A focus is the number of farms, a topic of particular interest given the long-term trend of a decline in the number of farms.
Model setup
The model is meant to capture the most important realities of supply management in Canada. It is not calibrated to a sector in particular. The import price is lower than the domestic price. This is generally consistent with what we observe for supply management sectors but not always. Lately, with the avian influenza outbreaks in the United States, prices for eggs in Canada are lower than in the United States. Some dairy products may also be cheaper in Canada than in the United States.
A typical economic analysis of production quotas uses supply and demand curves. I take this approach but I specifically model production decisions by individual farms to obtain the market supply. Farms differ in their cost structures, explaining differences in their size and profitability. Assuming non-identical farms allows me to examine how policies impact the number of farms, their sizes, and some issues regarding efficiency.
The model assumes the following:
- Farms produce an identical product.
- There are 1,000 potential farms who differ in their production costs. A farm produces if it can generate a positive profit.
- The production quota is 1,500 units.
- Market access (i.e., import quota) is 10% of domestic production. The import quota is filled because the import price is lower than the domestic price. Thus, the total quantity supplied is 1,650 units (1,500x1.10).
- The price paid to farms is fixed and equals $10/unit. The reason for fixing the price is that prices paid to farms in supply-managed sectors are based on cost-plus formulas. The price level is such that it may leave some of the quota rent to processors.
Baseline scenarios
The figure below illustrates the baseline scenarios. The figure shows two supply curves. The one labelled Supply is the normal supply curve. I will use the Supply, inefficient allocation when discussing supply management. I explain how to interpret that curve below.

Figure 1: Baseline scenarios
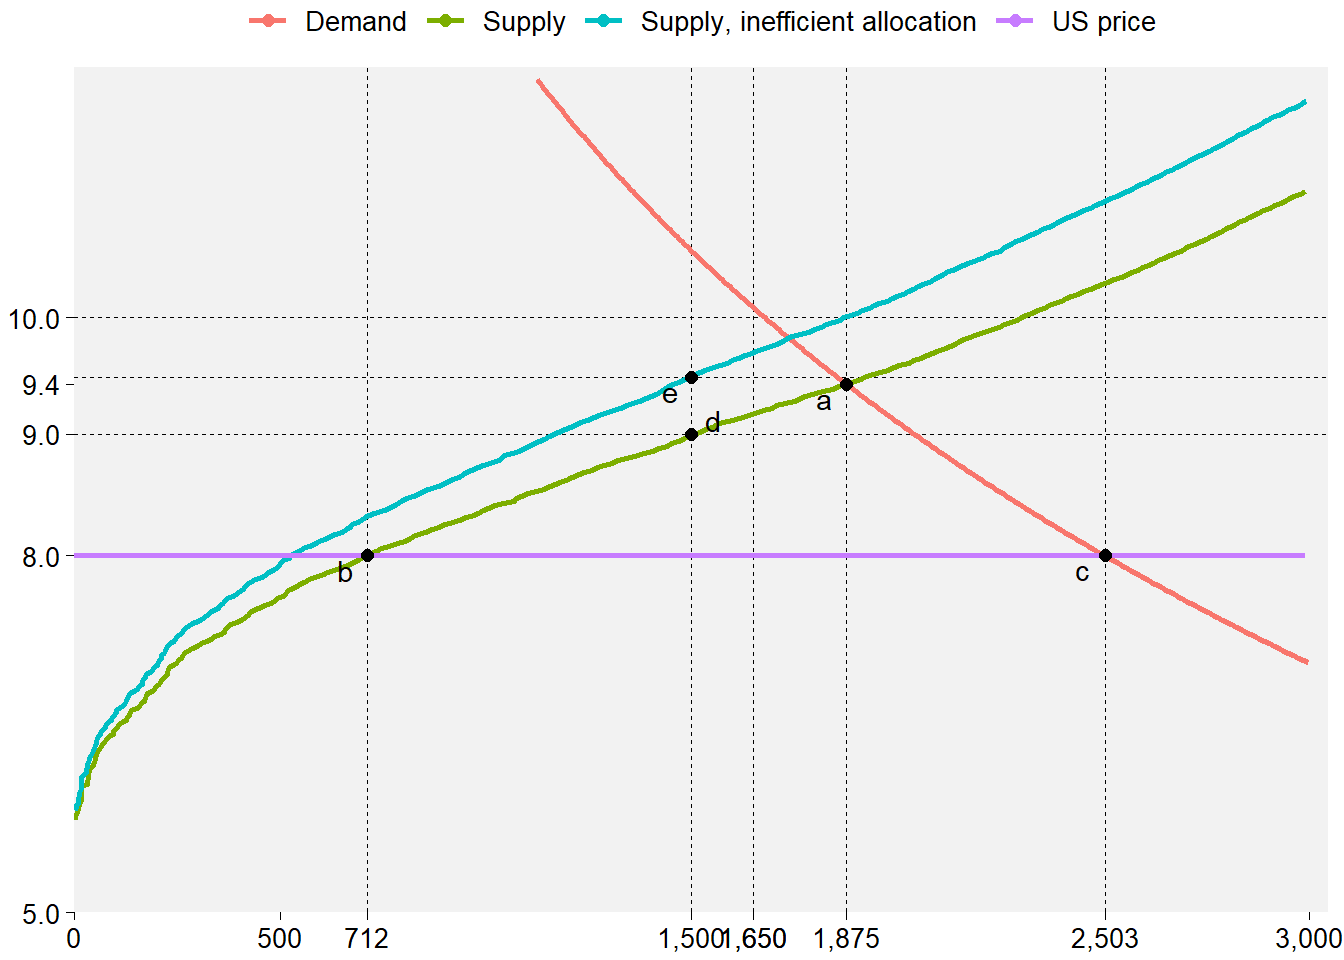
Table 1 complements Figure 1 by showing the outcomes of the baseline scenarios. The total value of the quota corresponds to the rent that goes to farms from selling at a price above their marginal cost. The producer surplus is an economic measure of producer welfare. It is calculated as the area above the supply curve but below the price, and includes the value of the quota.
| Scenario | Price ($/unit) | Domestic production (units) | Imports (units) | Consumption (units) | Number of farms | Avg. production per farm (units) | Total value of quota ($) | Producer surplus ($) |
|---|---|---|---|---|---|---|---|---|
| Autarky | 9.44 | 1,875 | 0 | 1,875 | 717 | 2.62 | 0 | 2,352 |
| Free trade | 8.00 | 712 | 1,792 | 2,503 | 282 | 2.52 | 0 | 1,558 |
| Supply management, efficient allocation | 10.00 | 1,500 | 150 | 1,650 | 582 | 2.58 | 1,470 | 3,118 |
| Supply management, inefficient allocation | 10.00 | 1,500 | 150 | 1,650 | 699 | 2.15 | 750 | 2,644 |
Autarky
Autarky is the scenario where there is no trade (imports and exports). This is a situation that Canada probably never experienced, and will likely never experience. The market equilibrium in autarky in Figure 1 is where the supply and the demand cross at point a. The price is $9.44/unit, domestic production is 1,875 units, there are 717 farms and the producer surplus is $2,352.
Free trade
In the free trade scenario, there is no barrier to trade and foreign goods enter Canada freely. The scenario assumes an import price of $8/unit. The price is constant because Canada is a small country, sufficiently small that it has a marginal impact on world prices for most commodities. In practice, the relevant world price for Canadian imports is often the US price. The total quantity demanded is at the intersection between the world price and the demand at point c, and equals 2,503 units. Domestic production is at the intersection between the world price and the supply at point b, and equals 712 units. Imports correspond to the difference between the quantities at points c and b, and equal 1,792 units. There are 282 farms and the producer surplus is $1,558.
Supply management
I consider two cases for supply management. The first case assumes an efficient quota allocation with farms freely buying or selling their production quotas. As a result, the most efficient farms, who value quota the most, have the production rights.
In the second case, I consider there are frictions that cause inefficiencies in the quota allocation. The ceiling on dairy quota prices in P5 provinces (Ontario, Quebec, New Brunswick, Nova Scotia and Prince Edward Island), and in British Columbia, is an example of a friction that leads to an inefficient allocation. The data on quota transactions show large differences in quota values across provinces and small transaction volumes relative to production in provinces with constrained quota prices. Bruno Larue, Alphonse Singbo and I show in a study published in 2017 that constraints on quota transactions make dairy farms less efficient and herd expansion unprofitable. For poultry and eggs, I expect that quotas are more efficiently allocated because frictions are not as significant as in the dairy sector. In Figure 1, the supply with an inefficient allocation lies above the supply with an efficient allocation.1
In both cases, the domestic production equals the quota set at 1,500 units and the price paid to farms is $10/unit. Market access equals 10% of domestic production, corresponding to 150 units. Consumption equals 1,650 units.
In the case of an efficient quota allocation, the marginal cost is at point d and equals $9.02/units. The value of the quota is calculated as the surface delimited by the price on the demand ($10/unit), the marginal cost ($9.02/unit), zero, and the quota volume (1,500 units): (10.00 - 9.02)x(1,500 - 0) = $1,470. The producer surplus is $3,118 (inclusive of the quota value) and there are 582 farms.
In the case of an inefficient allocation, the marginal cost is at point e and equals $9.50/unit. The total value of the quota is $750, the producer surplus is $2,644 and there are 699 farms.2
Analysis
I do not expect the free trade to happen in the near future. But, in the long term, the likelihood of that scenario increases. Compared to the two supply management cases, free trade leads to fewer farms, the loss of the quota value and a lower producer surplus. However, consumption is higher, which benefits consumers.
An inefficient quota allocation means a larger number of farms. The rules that cause frictions in quota transactions are a choice that provincial marketing boards have made to maintain a larger number of farms. Many farms choose to keep producing because the value they can obtain for their quota is low relative to the return they obtain from farming. The rules make quotas more affordable but less accessible because the volumes traded are lower, and as a result it slows down farm consolidation. In the case with an inefficient allocation, there are 699 farms, while with an efficient allocation there are 582 farms. The larger number of farms comes at the cost of a lower quota value and a lower producer surplus.
The downside of rules restricting quota transactions is that farms operate at a less efficient scale. In the model, the average production is 2.15 units with an inefficient allocation, while it is 2.58 units with an efficient allocation. The average farm size with an efficient quota allocation is similar to the average farm size in the scenarios for free trade and autarky.
Market access expansion
As mentioned at the outset, political parties in the latest elections have vowed to protect supply management but not to keep it in its current state. Market access concessions are a likely outcome of the negotiations. With this in mind, I investigate with my model a scenario where market access increases from 10% to 20%.
Figure 2 shows the outcome of expanding market access to 20%. At a quantity of 1,800 units, the total quantity given 20% market access and a 1,500 quota, that the price on the demand at point f is about $9.60/unit, below the price paid to farms of $10.00/unit. In practice, this is possible if the increase in market access is sufficiently strong. If such a situation occurs, it would be problematic for the economic viability of processors. Below, I consider two adjustments in response to this situation: A) a cut to the price paid to farms and B) a 10% cut to the quota. These are not optimal responses to increased market access. The values are selected with the purpose of providing an example. An optimal response likely includes adjustments to the price and the quota.
These two adjustments may not be necessary in the case of a small increase in market access. If market access is slowly increased over a few years, these adjustments may not be perceived because they are implemented through the absence of modifications in response to a growing demand. For example, without increased market access, it could be the case that the production quota would be increased by 2% in response to a growing demand. However, in the case with increased market access, the production quota may not be increased in response to demand growth.

Figure 2: Outcome of market access increased to 20% of production
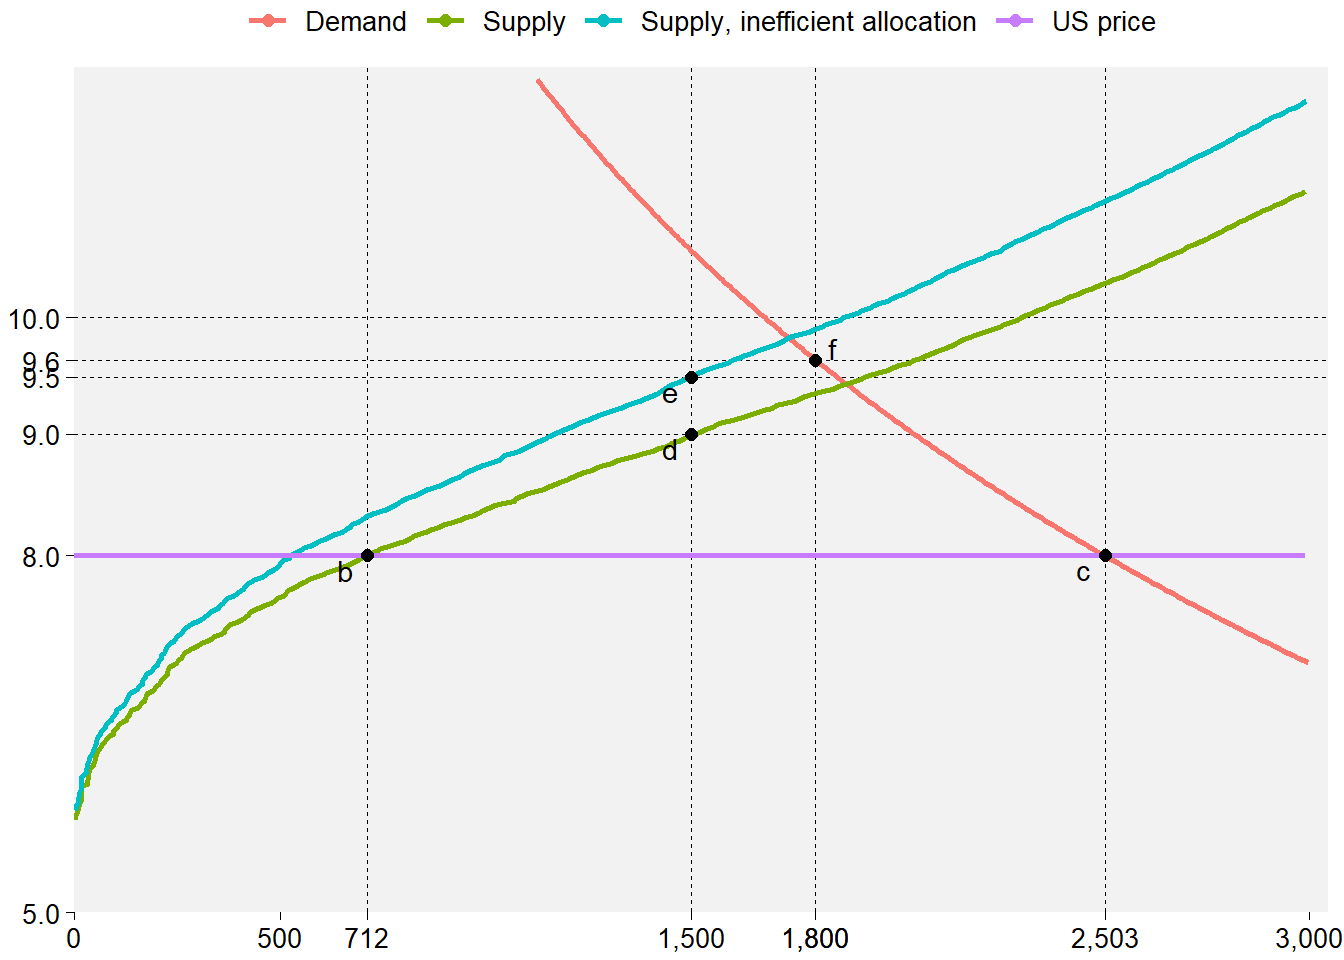
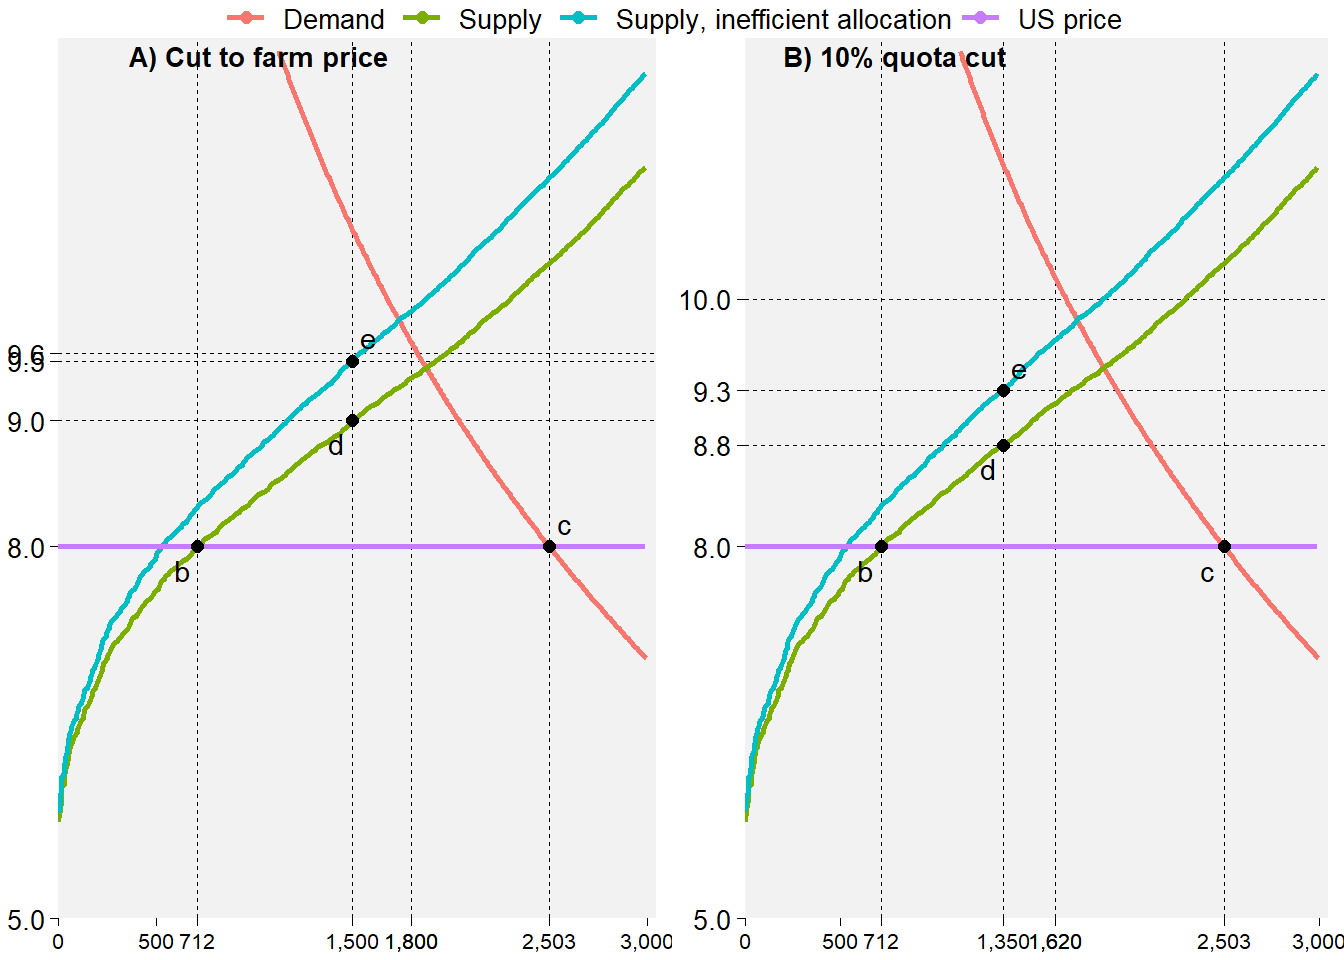
Figure 3 shows the two responses to increased market access. In panel A), the price paid to farms is cut from $10/unit to $9.56/unit: the production quota stays at 1,500 units, imports are 300 units and total consumption is 1,800 units. In panel B), the production quota is adjusted down by 10%: the production quota is 1,350 units, imports are 270 units, and consumption is 1,620 units.
Figure 3: Adjustment to the price or the quota in response to increased market access
The first part of Table 2 shows the solutions for the case illustrated in Figure 2. The next two rows show solutions for market access expansion with no change to the quota but a price cut from $10.00/unit to $9.56/unit as in panel A) of Figure 3. The last two rows show solutions for market access expansion with a 10% quota cut but not change to the price as in panel B) of Figure 3.
| Scenario | Price ($/unit) | Domestic production (units) | Imports (units) | Consumption (units) | Number of farms | Avg. production per farm (units) | Total value of quota ($) | Producer surplus ($) |
|---|---|---|---|---|---|---|---|---|
| No change in quota (1,500 units), no change to the price ($10.00/unit) | ||||||||
| Supply management, efficient allocation | 10.00 | 1,500 | 300 | 1,800 | 582 | 2.58 | 1,470 | 3,118 |
| Supply management, inefficient allocation | 10.00 | 1,500 | 300 | 1,800 | 699 | 2.15 | 750 | 2,644 |
| No change in quota (1,500 units), price cut ($9.56/unit) | ||||||||
| Supply management, efficient allocation | 9.56 | 1,500 | 300 | 1,800 | 582 | 2.58 | 810 | 2,458 |
| Supply management, inefficient allocation | 9.56 | 1,500 | 300 | 1,800 | 650 | 2.31 | 90 | 1,984 |
| 10% quota cut (1,350 units), no change to the price ($10.00/unit) | ||||||||
| Supply management, efficient allocation | 10.00 | 1,350 | 270 | 1,620 | 525 | 2.57 | 1,836 | 3,199 |
| Supply management, inefficient allocation | 10.00 | 1,350 | 270 | 1,620 | 677 | 1.99 | 1,242 | 2,796 |
Supply management, no change to the quota and the price
The price paid to farms and the quota stay do not change in response to market access expansion in this scenario. This is not a viable situation as mentioned above because of the burden it imposes on processors.
Supply management, no change to the quota, and price cut
This scenario considers that the price paid to farms is cut from $10/unit to $9.56/unit. I set the price at $9.56/unit because it is below the price at point f but above the price at point e in Figure 3. This leaves a rent to processors, improving their economic viability.
With an efficient quota allocation, the number of farms stays the same at 582, but the value of the quota drops from $1,470 to $810 and the producer surplus declines from $3,118 to $2,458.
With an inefficient quota allocation, the number of farms drops from 699 to 650, the value of the quota declines from $750 to $90 and the producer surplus decreases from $2,644 to $1,984.
Supply management, and 10% cut in production quota, and no change to the price
Cutting the production quota by 10% means that, at the total quantity of 1,620 units, the price on the demand is above $10.00/unit, leaving a rent to processors.
With a 10% cut, the total value of the quota and the producer surplus increase whether the quota allocation is efficient or not. This does not have to be the case. If the quota cut is smaller, say 5%, the values for the quota and the producer surplus would have declined, but the rent to the processors would have been negative, making this economically unfeasible. This illustrates that it might be difficult to adjust the quota in response to increased market access and satisfy all the actors involved in the supply chain.
Table 2 shows that with a 10% quota cut, the number of farms declines from 582 to 525 in the case of an efficient allocation, and declines from 699 to 677 in the case of an inefficient allocation.
Analysis
Table 2 shows that the response the industry adopts to increased market access matters a great deal. The values in Table 2 depend on the choices I made (10% quota cut or a price cut from $10.00/unit to $9.56/unit). In practice, this shows that choices made by producer boards will be consequential.
The best course of action in response to increased market access likely involves pulling on several levers, including adjustments to the price and the quota. What the model shows is that it will be difficult, if not impossible, not to lose farms in the process. The best outcome in the model regarding the number of farms is when the quota allocation is efficient, the price is cut and the production quota stays the same.
Concluding thoughts
Canada conceded market access in CETA, CPTPP and CUSMA. My thought at the time Canada signed these agreements was that sectors under supply management knew what to expect for many years ahead and could adapt to increased international competition. Given recent developments, this is obviously not the case.
Supply management is weaker now than when CUSMA was signed in 2019. For that reason, the impacts of further market access concessions will likely be different. I do not know how close Canada is from having pseudo supply-management systems for dairy, poultry and eggs. The tipping point from a meaningful production quota to a meaningless quota might not be very far. That is an empirical question that deserves studying.
My model shows that the number of farms is lower with an efficient quota allocation, while an inefficient quota allocation, because of rules that limit quota transactions, supports a larger number of smaller farms. The efficient quota allocation provides more value in terms of quota and producer surplus, and farms are more resilient to increased market access.
My understanding is that quota allocations are quite efficient in poultry, eggs and in dairy in the Prairies (Alberta, Saskatchewan and Manitoba). In the P5 provinces and British Columbia for dairy, various quota rules, including price ceilings, create frictions, lower the number of transactions and yield an inefficient quota allocation. If the trade negotiations lead to a significant and quick increase in market access, the risk is to see the number of dairy farms decline sharply in P5 provinces in particular.
The Canadian government compensated farms after signing CETA, CPTPP, and CUSMA. The payments are substantial. I expect the federal government to provide similar support if additional market access is given to the United States. These payments will slow down farm exit but will not stop it. Economies of scale mean that larger farms are more efficient, and given them, consolidation is an inevitable fact.
Liberalizing dairy quota transactions in P5 provinces would yield a high quota price. This is certainly not be a desirable outcome to some, but it does have upsides. Some farms would choose to sell their quota, giving them significant compensations and the opportunity to exit on their own terms. Farms who wish to expand will have access to quotas and exploit economies of scale. As a result, they will be in the best position to compete with American farms if additional market access is granted in upcoming negotiations.
-
One interpretation is to think of the inefficient allocation as a short-term outcome, while the efficient allocation is the long term outcome. The supply is never fully efficient because of technological improvements and lags in technology adoption. Frictions from restrictions on quota trade slow down the adjustment from the short- and long-term outcomes, effectively increasing the gap between the efficient and the inefficient supply. ↩︎
-
The way I calculated the value of the quota with the inefficient allocation could be debated depending on the interpretation given to the supply curve with an inefficient allocation. However, the lower value for the quota is consistent with the price ceiling for dairy quotas in several provinces. ↩︎